Possible enhancement: RDF browsing
A nice enhancement to the developer experience might be a sort of RDF browsing utility, something that helps people get acquainted with the structure of an ontology without having to dive deeply in docs to get a taste of it, or to help developers visualize mistakes in past INSERTs/DELETEs or why a SELECT query might be missing some key data.
The most typical way to represent RDF triple data is by drawing nodes and edges representing every existing triple, example from Wikipedia:
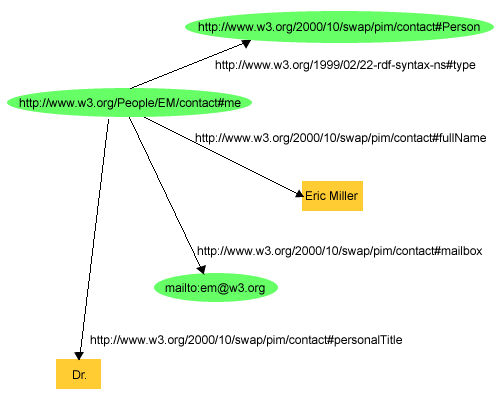
While this is fine for a "ooh, so that's RDF" moment, it easily becomes too noisy to represent anything but small chunks of data. Also, properly displaying large graphs in ways that there are not too many edges crossing is a challenge that even tools dedicated to this struggle with. Example from Researchgate.net to drive the point home:

I think it would be better to steer away from that approach, and that it would be nice to find the clearest way to offer as much key information without having the users drown in it.
I came up with the following (and very lame) mockup:

I think this comes to show the most fundamental information about a RDF resource, one at a time:
- The things it points to, and through where
- The things that point to it, and through where
- Every other property that "points to" literal data (strings/ints/booleans/...)
Making it easy to navigate between those (hence, "browsing", more than "visualizing"), while keeping the crazy bits at a minimum (e.g. avoiding too much edge overlap), and also being friendlier to cpu usage overall (e.g. not querying or representing too much at once).
Final UI subject to improvements, or I hope it will :p.